Product Planning and Expected Return
An explanation on the crudeness of calculating expected return on specific feature launches and an attempt to prove it
If We Build It, Will They Come?
Founders start companies to solve a problem. They usually have deep industry expertise and a vision. But companies that fail to solve that problem—or fail to do it better than the competition—ultimately cease to exist.
As companies scale, they confront a fundamental truth: their available market is finite. Growth slows, and they start searching for expansion levers, largely in the form of upselling, new market entry, or efficiency improvements to reduce cost. The challenge for Product teams becomes deciding what to build, given the competing priorities from customers, executives, other internal teams, and the technical realities and limitations of software development.
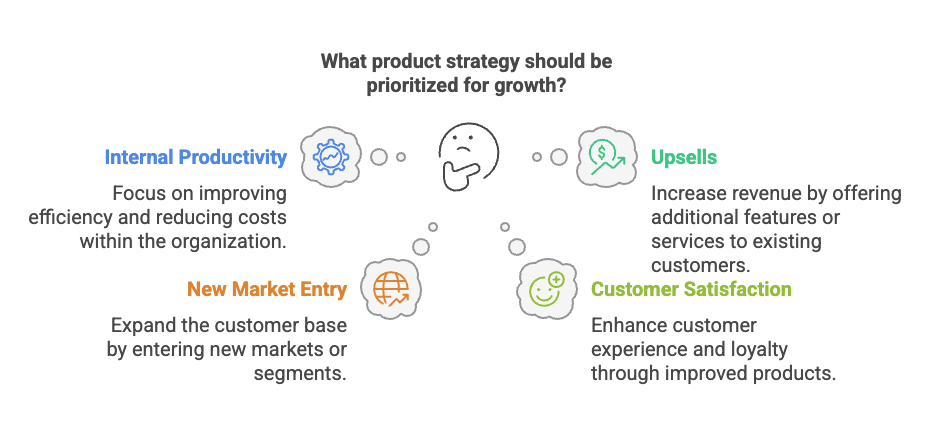
Now the challenge comes with what to build. Let’s divide the argument between four main categories of product growth activities: Internal Productivity, Upsells, New Market Entry, and Customer Satisfaction.
The Four Horsemen
Let’s use an analogy of a sponge to illustrate this concept. Imagine you pick up a sponge and start to squeeze water out of it into a number of cups.
- The sponge represents the total addressable market.
- The total water in the sponge is the available revenue in that market.
- The hand strength it takes to wring out the water is the internal effort to capture that water.
- The cups are the company's captured and recurring revenue after costs.
- There are holes in the bottom of these cups that represent churn.
- Multiple hands (competitors) are squeezing the same sponge into their various cups.
Now, let’s break down the primary ways companies attempt to squeeze more water from the sponge:
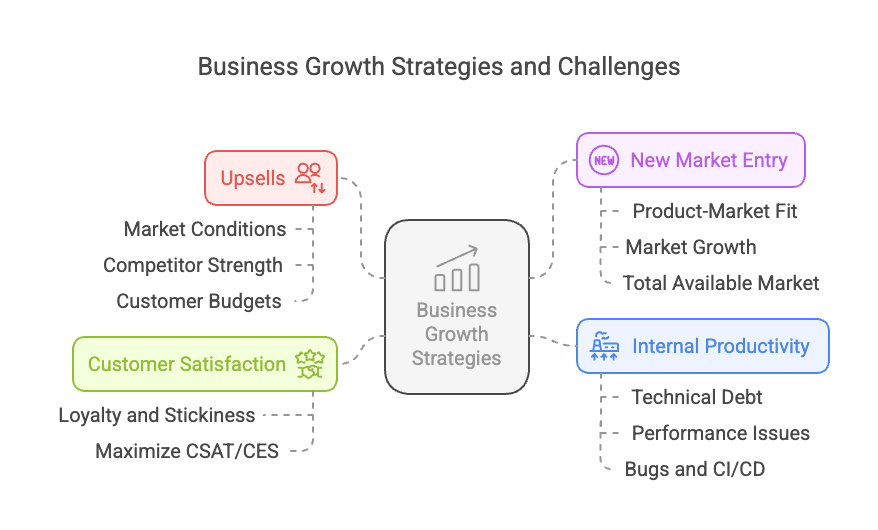
Upsells (Growth Focus)
Many companies believe they can squeeze more money out of existing customers. Some come to this realization after they believe they have capped the addressable market. Others arrive at this approach believing they can attract other dollars from their customers that may be spent with competitors. However, this assumption can be flawed because:
- Market conditions affect how much "water" is left in the sponge. For example, interest rates may slow growth or changing consumer demands may shift production lines or focus.
- Competitor strength influences pricing pressure.
- Customer budgets are not unlimited. Some even have zero-based budgeting practices which make this practice even more difficult and long-tailed.
There are absolutely possibilities in this space, especially in B2B or Enterprise deals. However, companies must then recognize when their sponge has - or is about to - run dry and seek out markets that are also growing.
New Market Entry (Growth Focus)
Expanding into new markets seems straightforward, but it is anything but. Companies must dedicate adequate time to research and survey any new markets the company hopes to enter to identify whether or not it is a focus of the company and if their product will solve those new customers problems. This approach often requires:
- Identifying product-market fit. An ESPN interview case study illustrated this well when the ask was for interviewees to try and price the 'High 5' candy bar that was about to go to market (this was never real, but it was a test used to assess advertising effectiveness in NFL content).
- Reconfiguring the product or developing a new one. This could be as simple as copy changes to as complex as an entirely new Platform ecosystem.
- Aligning marketing, go-to-market, and sales efforts. This often means either net new or revisioning existing materials and training sessions
However, new markets are not always a silver bullet. Even the largest markets have a limited amount of sponges and water - and there are often hands already gripping those sponges. We must also not forget to let the boat sink and allow the current water in our cup to spill out.
Customer Satisfaction (Retention Focus)
Customers stay as long as the product continues to deliver value. However, retention efforts often take a backseat to growth initiatives.
Common retention metrics include:
- Customer Satisfaction Score (CSAT)
- Customer Effort Score (CES)
Ignoring these initiatives leads to increased churn when competitors offer a better or cheaper alternative.
Internal Productivity (Sustainability Focus)
Neglecting internal productivity results in:
- Accumulating technical debt.
- Slower performance and increasing bugs.
- A fragile, inefficient development process.
Since these efforts do not have direct revenue impact, they are often overlooked—until an infrastructure failure forces action.
The Weaponization of 'Prioritization'
Capacity is finite. Even if a company hires 1,000 engineers tomorrow, onboarding and dependencies prevent immediate acceleration. Additionally, many features and lines of effort can not be completed by multiple engineers at one time. You can hire 1,000 people to change a lightbulb, but it will not speed up the process.
"If everything is a priority, nothing is."
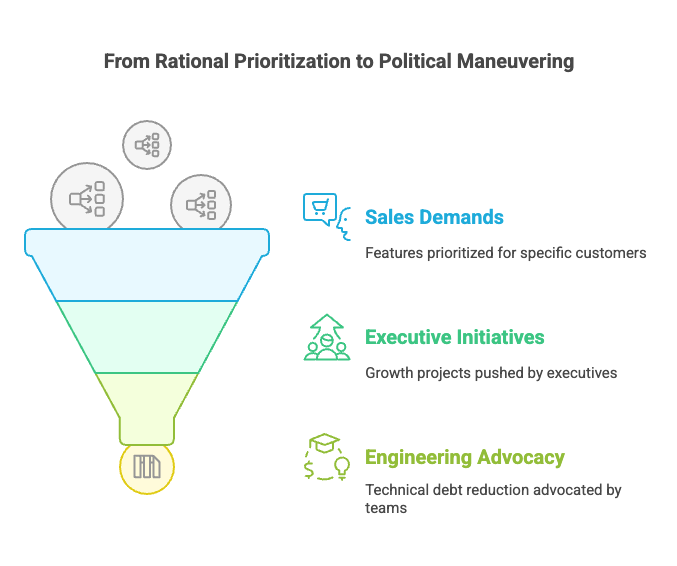
Prioritization should be rational. We should spend our time building the products that our customers need to solve their problems and to maintain them in a way that continues to improve their workflow. But often, prioritization becomes political:
- Sales teams may often demand features for specific customers. These may result in company specific features that makes code maintenance on a J-curve trajectory of complexity and should be avoided. This practice is also short-sighted as we will have to dedicate future engineering capacity towards this maintenance that could have been dedicated to planned features.
- Executives push growth initiatives. On the surface, this is not detrimental. These executives often have years of experience and usually have a strong pulse on the market. The problem with this lies when there is either conflicts between executive asks and product metrics or when these unplanned asks grow to a larger and larger percentage of the pie over time.
- Engineering teams advocate for technical debt reduction. This is usually done when they are trying to keep their head above water as they spend the majority of their time fixing bugs or responding to 'P1/Sev1' issues.
- Product teams may not have done proper research and are acting on gut alone. This may be due to a number of factors, but usually that Product does not have enough time to talk to customers or conduct research - or they simply lack the motivation to do so. The backlog isn't going to clean itself and that last minute PowerPoint deck that will never be used again needs someone to create it, you know?
Without a clear framework and focus, prioritization turns into a defensive maneuver rather than a strategic decision.
Hocus Focus
Great companies say "no" more often than they say "yes." They understand the user and what their immediate needs are. The key to prioritization is focus.
The military has a concept called the "Commander’s Intent". It is a guiding directive that all new Commander's create to ensure their teams make aligned decisions without having to get their approval on every minute detail. Companies need the same.
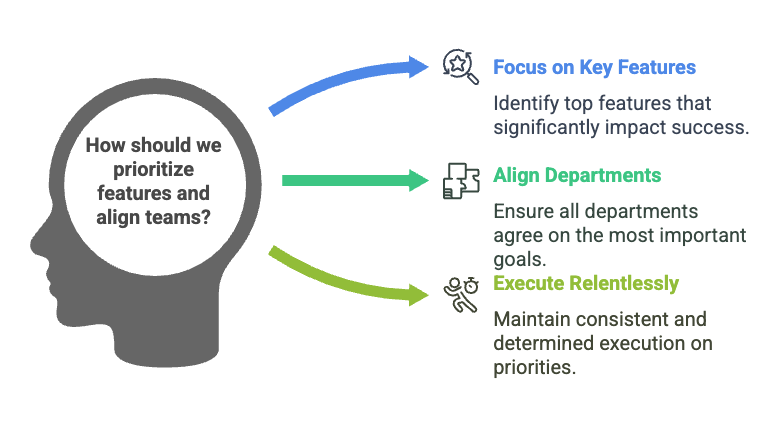
Instead of attempting to build everything, great product teams:
- Identify the top features that truly move the needle. This is a bit of an overused phrased - and often weaponized as often as prioritization is - but it speaks to the root of the capacity dilemna. Spend the most time on the work that will improve our customer's lives or work the most. Everything after that is gravy.
- Align across departments on what matters most. This will require collaboration and hard conversations. The term 'product-led growth' would cease to exist from our terminology if this happened in practice.
- Execute relentlessly. Commit to the priorities. Realize what's important. Fail forward.
"Plans are worthless, but planning is everything"
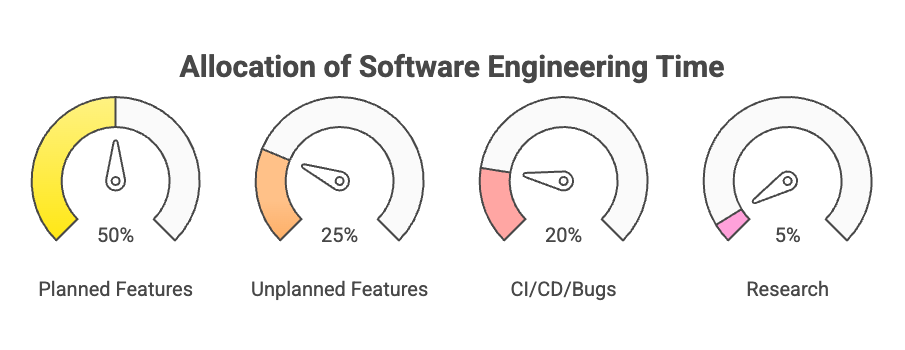
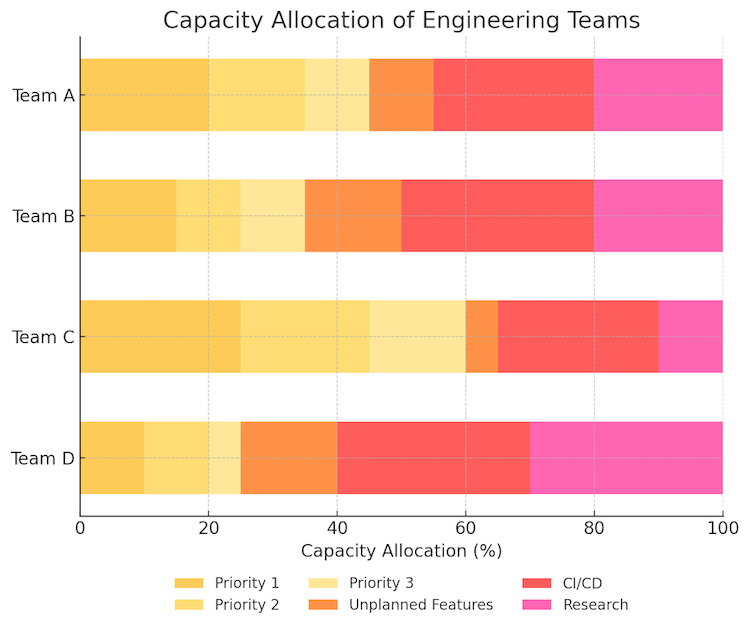
Thus, a truly optimized capacity plan may look something like the following where different team's time is dedicated to different priorities, features, CI/CD and research:
Time to Prove It
Now that we’ve covered the thought process, let’s quantify impact.
Below is a forecasting tool that will estimate the best, expected and worst case scenarios for a given feature or product when directed against one of the Four Horsemen discussed above.
Your task is to try and utilize this tool. To start, take a single feature or product you are expecting to launch but only use single numbers, not ranges. Take note of the expected outcome.
Step 1: Define a Single Feature or Product
Enter expected values (e.g., adoption, revenue potential, retention impact).
Calculate the forecast for any of the Four Horsemen you are interested in.
Step 2: Scenario Based Modeling
Once you're done, let's introduce the concept of variability because the future is under no obligation to comply with your plan or forecast.
Instead of fixed numbers, use ranges where applicable—e.g., expected upsell rates might be 2-5%.
Step 3: Evaluate Trade-Offs
Compare features based on:
- Engineering effort
- Strategic fit
- Impact on engineering sustainability
Now take note of the total range of returns for each calculation you complete. This is what should be utilized when planning - especially if you are trying to calculate for a single or packaged set of features. Now you can try and add up all the features you are 'focusing' on and have better signal as to what are the possible outcomes.
By adopting probabilistic thinking, teams make informed trade-offs instead of relying on gut instinct.